Topic Doc: Dashboard Charts and Tables
RecTrac 3.1

Written by Daniel Rotondi
Updated at February 8th, 2023
Table of Contents
Document Summary
The following is a step-by-step walk-through of how to create a Dashboard Chart in RecTrac. This document uses the Pass Membership Report as an example.
The key concepts of Dashboards are described below.
Choosing a Report on which to Base Your Dashboard
Dashboards are a specialized, graphical output of standard or customized reports. You start with a report that has an Output Type of Summary and includes subtotaling you want to visualize through your Dashboard. The following are examples of Standard VSI Reports and Output Templates will work well with Dashboards:
| Report | Output Template | Output Type | Notes |
| Activity Section Reports | VSI - Activity Section Listing Report | Summary | Graph enrollment sums by section |
| Activity Reports | VSI - Activity Listing Report | Summary | Graph enrollment sums by activity |
| Facility Reservation Reports | VSI - Facility Reservation Report | Summary | Display a table of today's reservations at your facilities |
| GL Distribution Report | VSI - GL Distribution (Dynamic) | Summary | Graph financials by GL code |
| Pass Membership Reports | VSI - Pass Membership Report | Summary | Graph membership sums by pass |
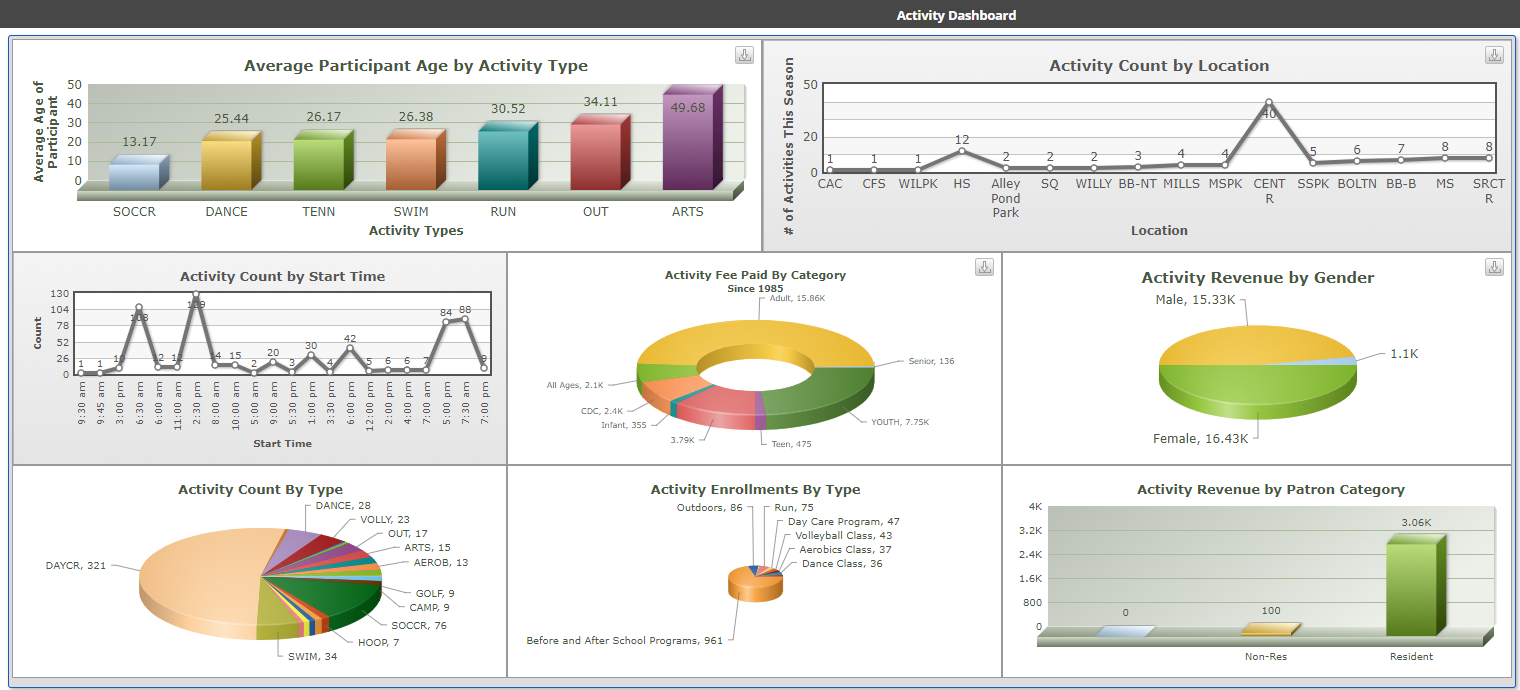
Below are examples Dashboards displaying membership and activity data:

Note: Advanced users may choose to create a custom Output Type for a standard report (See the Add button on the Report Output Management) to get the Summary and subtotaling needed for specific Dashboards. They may also create custom reports with the needed subtotaling and summary information.
Using Report Criteria to Determine What Data is Included
Once you've selected a report, you set criteria as appropriate for your Dashboard. Often, you target a subset of records (such as specific facilities, activities, or passes). Also key is setting an appropriate date range (such as today, this week or month, or another timeframe).
Scheduling Report Output to Dashboard
Set your report to the Schedule Only option of Dashboard Chart or Table. The schedule determines how often the data underlying the dashboard is refreshed. For Example: If you are tracking today's pass swipes on your dashboard, then you might want a refresh every 5 minutes. If you are tracking demographic breakdowns of your patrons then a daily refresh of that data is sufficient.
Create the Chart and Tie it to the Scheduled Data
You use Chart Management to create the chart record and link its data. The chart record determines how the data displays and you can choose line and pie charts, bar graphs, and others. Also, you can output data to a table, which can be helpful for an activity registration monitor.
Add Dashboard to RecTrac Menu
Through Menu Management, you will add your new Dashboard to the menu. Standard menu permissions apply, and you will use a menu for those who should see it. Often dashboards are used by Supervisors and Directors, and would add it to a menu with sufficient permissions.
License – Maintenance Agreement
The Dashboard Charts Interface is free. Use of the interface requires a VSI license and annual maintenance agreement for RecTrac and the component modules discussed in this document. Prior to implementing any process outlined in this document, please contact the Vermont Systems Sales department at 1-877-883-8757 to verify that you are authorized to use the modules discussed in this document and if not, to obtain a quote and/or approval.
Setup Steps
This document will walk you through the basic steps required to create a Dashboard with a chart or graph through RecTrac. If you have additional questions about Dashboards after reading this document, please contact Vermont Systems Customer Service by phone at 877-883-8757 or generate a Support Case through the Customer portal of the Vermont Systems web site using your Customer ID and password.
Before You Begin
This document is written with the following assumptions. If any of the items listed is NOT true, contact Vermont Systems Support prior to continuing.
- Your organization is running RecTrac 3.1.04.00 or greater.
- The User ID with which you sign into RecTrac has the requisite permissions and ability to access the Chart Management and Menu Management.
- You are familiar with RecTrac reporting criteria, menu security, and are familiar with the data intended for use in your Dashboard.
- You understand RecTrac DataGrids and how to maneuver through them.
File Maintenance Setup
This document will guide you through the process of setting up a Pass Membership Dashboard. You will:
- Use the Pass Membership Report to gather the data needed for your Dashboard.
- Create the Chart/Graph record and then link it to the underlying data.
- Add your new Chart/Graph record to the Menu Design used by the appropriate users (such as Managers or Directors).
- Test out your new Dashboard to verify results.
Note: All file paths and screen/tab locations in this document refer to file paths and screen/tab locations as they appear in the standard, default VS Design. Your setup and Design may vary.
Gathering Data
In this example, you will use Pass Membership Reports as a basis for your Dashboard. The process is similar with other reports.
- In RecTrac, go to the Management Ribbon • Reporting • Pass Reports group • Pass Membership Reports.
- Configure the report as desired using its available DataGrid, Range, Filters, and other fields. Often, Dashboards limit the data shown to a specific date range, like today, this week or month. Dashboards might limit the records to a subset.
- Click Process. The Report Options screen opens.

- Deselect the PDF File Format to prevent it from opening each time the event processes.
- Select the Dashboard Chart or Table option.
- Use the "i" and "?" Help icons Help Icons on the upper-right hand corner of the screen for field definitions, if needed.
- Click Schedule. The Schedule Generator screen opens.

- Enter Chart - Pass Memberships for the Schedule Name. Grouping all of your dashboards together with a prefix of "CHART-" is helpful. The name you enter here MUST be selected within "Create Chart Record" section.
- Determine the schedule on which you want the system to refresh the data within your Dashboard. Specify the Begin and End Date range, Weekdays, and Time range. Depending on the Dashboard data you are working with, you might refresh the data frequently or once daily. For Example: You may have your Pass Membership Dashboard might refresh run May through September, Monday through Friday, at a Time Interval of 15 minutes between 8am and 8pm. Use the "i" and "?" Help icons Help Icons on the upper-right hand corner of the screen for field definitions, if needed.
- Click Save.
- Continue with the Create Chart Record section.
Creating the Chart/Graph
In this section, you will link the data from your Scheduled Task to a Chart. The Chart record enables you to configure how data displays. For this example, you will choose a 2D pie chart. You can define chart captions <x> and <y> labels, font sizes and other similar information.
- In RecTrac, go to the Management Ribbon • System Management • Report Management group • Chart Management. The Dashboard Chart/Table Maintenance Start screen opens.
- Click Add. The Dashboard Chart/Table Maintenance Update screen opens.

- Enter Chart - Pass Membership for the Chart Name. You MUST reference this Chart Name when adding it to your Menus through Menu Management.
- Click the Drop-down List to select Single Series Data, which will create a graph. A "series" is a column of data that you want to plot in a chart or display in a table. For Example: Your Dashboard displays the sum of each Pass Type transaction within the report criteria (a date range and any additional filtering set).
- Click the Drop-down List to select Pie 2D.
- Enter Pass Count by Pass Type for the Chart Caption which will display above your chart. Useful to note the chart's purpose or content.
- Enter 340 for the Refresh Interval (Seconds). Determines how often the Chart is redrawn. Refreshing gathers the latest data available from the last time your Scheduled Task was run, and depends on that Scheduled Task to process on a similar interval.
- Optional. Enter the Chart Sub Caption.
- You might provide an additional line to explain the chart's purpose or content.
- Accept the default entry (8 pixels) for Chart Font Size or enter an alternative, if desired. Allows you to increase or decrease the font size of your chart as needed.
- Click the Drop-down List to select Chart-Pass Memberships for the Chart Report Schedule Link. This is the Schedule Task from the previous section.
- Optional. Enter an X Axis Label. A description of information shown horizontally across the X-axis of your chart.
- Optional. Enter a Y Axis Label. A description of information shown vertically across the Y-axis of your chart.
- Expand the Drop-down list and select Chart-Pass Membership for the Chart Report Schedule Link. This is the Scheduled Task you created in the prior section.
- Click the Drop-down List to select the Single Series Value Field of SADetail_ID. Often this is an ID field. Depending on the report, this might reference unique IDs of transactions, households, family members, etc.... For Example: With your Dashboard based on the Pass Membership Report, this is based on the transaction ID (SADetail_ID) field. You graph the number of unique pass purchases occurring within your chosen date range.
- Click the Drop-down List to select the Single Series Label Field of PMPass_PassCode. Depending on the report you are basing your Dashboard, you might subtotal based on pass, activity, section, GL, or facility codes/types. For Example: For the Dashboard based on the Pass Membership Report, you are subtotaling based on the pass type/code (PMPass_PassCode) field.
- Click Save to return to the Dashboard Chart/Table Maintenance Start screen.
- Close the Dashboard Chart/Table Maintenance Start screen.
- Continue with the Link Chart to Menu Design section.
Adding to Your Menu
Next, determine where the new Dashboard will display within your RecTrac menu. To do this, create a new menu item and choose its placement within your menu structure. Often Dashboards are placed within Home but can go anywhere.
- In RecTrac, go to the Management Ribbon • System Management • User/Menu/Profile Management group • Menu Management. The Menus Start screen opens.
- The DataGrid displays the various custom Menus your organization defined. For Example: You might have Menus defined for POS users, another for managers, and another for the director.
- Highlight the desired Menu that you'd like to add this Dashboard (such as Managers or Director) and then click Change.
- The Menus Update screen opens with three columns: Available Fields, Fields on Screen, and Field Parameters that are described in detail below.
- The Available Fields DataGrid column displays the Types of fields (such as Tabs, Groups, and Buttons) that are available to be added to the menu that you have selected. In the steps that follow, you will select Groups and a button to make your Dashboard available within the menu structure.
- The Fields on Screen column appears in "tree" format and lists the Tabs, Groups, and Fields that appear on the menu that you've selected. As a general rule, Fields nest into Groups, and Groups nest into Tabs; and "top to bottom" on the tree equates to left to right on your screen.
- The Field Parameters DataGrid column displays the basic field structure of the field you've selected from the Fields on Screen column.
- Build your menu structure through the steps that follow. You will drag and drop four (4) items from the Available Fields DataGrid to the Fields on Screen tree, in the order listed. Review the screenshot to verify that you've got them correct.
- At the top of the Available Fields DataGrid, enter Generic into the Field Name filter. The DataGrid is filtered to include only fields that include the word Generic within them.
- Expand the Group Field Type and then locate the Generic_MenuGroup.
- Expand the Home folder within the Fields On Screen tree.
- Drag and then drop the Generic_MenuGroup from the Available Fields column to the Home folder within the Fields On Screen tree (Release when Green). For purposes of this example, the choice is Home, which is the most common location for Dashboards. However, you may place them anywhere within the menu structure that makes the most sense for your organization's needs.
- Expand the Button Field Type and then locate the Generic_Button.
- Drag and then drop the Generic_Button from the Available Fields column into your new Generic_MenuGroup within the tree.
- Drag and then drop a second Generic_MenuGroup from the Available Fields into your new Generic_Button within the tree.
- Expand the Chart Field Type and then locate the Generic_Chart.
- Drag and then drop a Generic_Chart from the Available Fields into your second new Generic_MenuGroup within the tree.

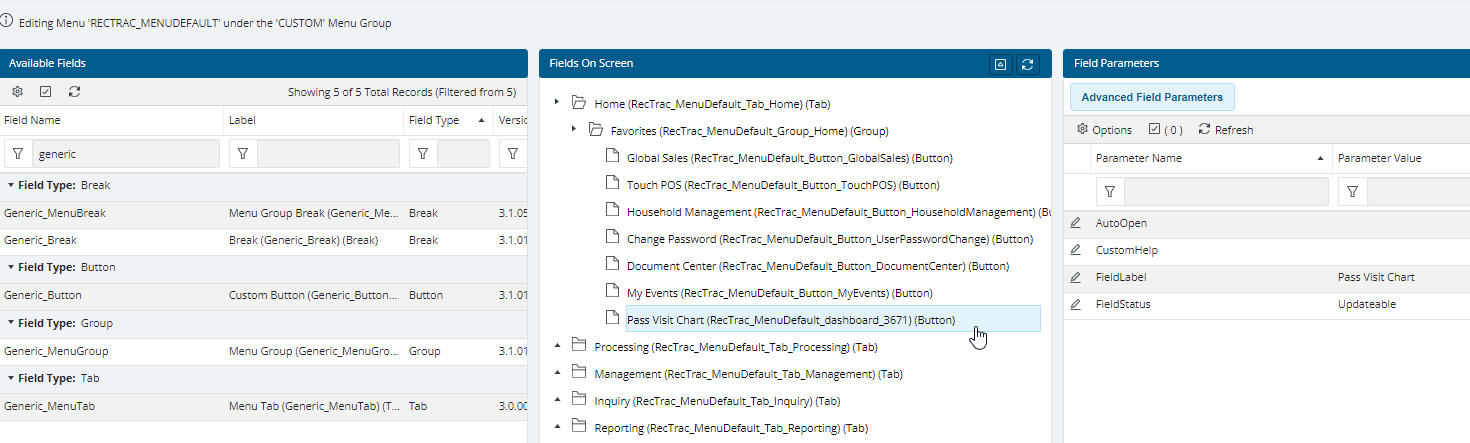
Note: It's helpful to give a unique label to the new Generic_Button field (see the FieldLabel option in Advanced Parameters). The above steps add a button to your menu, and its default label is Custom Button. You might change it to Pass Membership.
- Highlight your Generic_Chart entry within the Fields on Screen tree in the middle of the screen. Next, you'll link the Chart Record to the menu.
- Click on Advanced Field Parameters. The Menus Edit Parameters screen opens.

- Click the Drop-down List to select the ChartLinkID of Chart-Pass Membership. This links the Chart Name from the previous section.
- Click Save and you will return to the Menus Update screen.
- Click Done to return to the Menus Start screen.
- Close the Menus Start screen.
Testing
In this section, you will force the scheduled process to run, and then test out your new Dashboard.
Testing your Dashboard:
- In RecTrac, go to the Management Ribbon • System Management • Misc Management group • Scheduled Events Management.
- Highlight your Scheduled Event and then click Run Event Now. For your new Dashboard to display data, it must exist. Although, you could wait for your Scheduled Event to occur based on the timeframe you've specified (such as an hour or day), this process causes the event to execute immediately.
- Next, Log out and End Session.
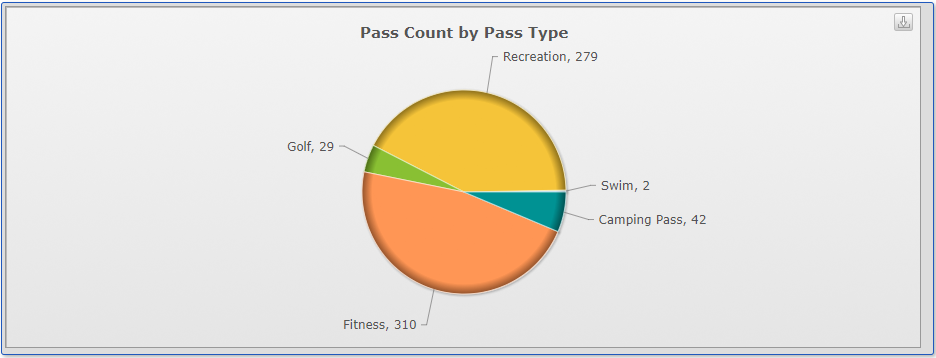
- Log back into RecTrac and go to the menu location of your new Dashboard. If you followed the pathing in this document, then that would be the Home menu. Your new Dashboard should display similar to the one shown below.
If you would like to change the configurations of your Scheduled Task:
- In RecTrac, go to the Management Ribbon • System Management • Misc Management group • Scheduled Events Management.
- Click to highlight the record in the DataGrid.
- To edit the schedule under which the event executes, click the Change Event button. Revise the event's schedule as necessary.
- To edit the underlying report configuration, click the Update Event Settings button. Change your report criteria as desired.
- Return to Scheduled Events Management, select Chart-Pass Memberships and then click Run Event Now.
If you would like to change the configurations of your Chart:
- In RecTrac, go to the Management Ribbon • System Management • Report Management group • Chart Management.
- Click on Chart-Pass Memberships. Change your Chart Record as desired and then Save.
- Return to Scheduled Events Management, select Chart-Pass Memberships and then click Run Event Now.